Stop Using Velocity To Measure Your Teams — Try These Metrics Instead
Metrics without context are a waste of time.
Velocity can be a helpful numerical representation of work completed for executives and managers, but it doesn’t tell the full story. It leaves out critical information about what happened over the course of a sprint, regardless of the length.
Can velocity answer:
How many folks were out sick or on PTO for that week?
Cards that were added/removed?
Points added/removed?
General scope volatility trends?
Other questions about sprint fluctuations?
The answer is no.
If you are only measuring a team by velocity, you’re going to get gray hair fast and your teams will begin to despise you. Below I’ll outline some additional metrics that I like to keep track of to understand the ebbs and flows of work on a team. This is not a stick to measure people with, it’s a tool to understand the volatility you and your team face from sprint to sprint.
For all of these metrics, volatility should minimize over time, making it easier to understand anomalies.
Here’s a Google Sheet with 2 sample teams.
Net Estimate Shift +/-
Depending on how your team approaches estimates and adjusts them in the sprint, Net Estimate Shift may be irrelevant.
When I’m starting with teams, we like to challenge estimates as we get into the work to see if we’ve learned anything new between estimation and starting the work.
Generally, this number should be low but add some conditional formatting to understand when estimations are shifting frequently.
Points Added / Removed
Especially if you are on a team that is actively supporting an application while also moving into the next phase of work, Points Added and Points Removed can give you a sense of what new work is coming into your sprints. Higher volatility here could mean the requirements were unclear, not thorough enough, or in some cases, a stakeholder changed their mind mid-sprint.
When Points Removed is high, analyze why that happened.
Was there a chunk of work that was de-prioritized?
Was something unclear at the beginning of the sprint that crystallized?
How do you get ahead of that in the future?
Weighted Team Projection
Note: Weighted Team Projection is more for estimating your next sprint. You will need 5 sprints in order for Weighted Team Projection to start becoming useful and even then it will need several months before it starts lining up more accurately.
to
The equation:
.05(s1)+.1(s2)+.1(s3)+.25(s4)+.5(s5) = WTPWeighted Team Projection looks at your last five sprints (s1-s5) and adds weight based on how far in the past the sprint was. The weights are added to each of those sprints accordingly (5%, 10%, 10%, 25%, 50%).
Once added up, Weighted Team Projection gives you a rough estimate of what your team should be able to accomplish in the next sprint. The projection is helpful when looking at a reasonable amount of work to complete for the next sprint.
Carryover ∆
Pretty simple, but this is a percentage of how many points are carrying over into the next sprint vs how many points were committed. It is a raw data point and doesn’t take into account why things changed.
Adjusted Percentage Commitment Met
Not everyone agrees with me on this one, but that’s alright. The intent of Adjusted Percentage Commitment Met is that it factors in everything that happened throughout the sprint and gives you an assessment of, all things considered, how did we do?
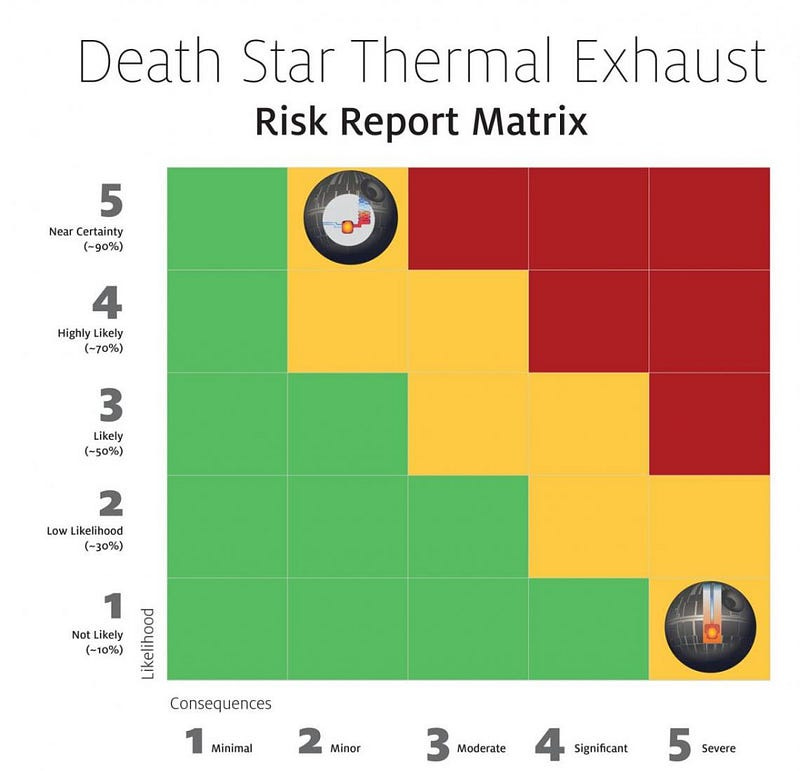
For me, a tolerable number here is between 80% and 120%. A great number is between 90% and 110%. Think of APCM (what a great acronym eh? /s) as the exhaust port on the Death Star. There’s a bit of wiggle room in either direction, but the further away from 100%, the less desirable the outcome.

Scope Volatility
Pretty straightforward here, but scope volatility takes a look at Net Estimate Shift, Points Added and Points Removed, divided by the total Committed points in your sprint.
Scope Volatility is our best percentage look at how things shift during the sprint and whether we are blowing the sprint up by adding or removing points, and whether we are adjusting estimates without balance. It’s definitely a quick reference number, similar to Adjusted Weight Completed.
Another Look
With the above in mind, how would you feel about your team’s velocity if it looked like this?
Your answer should now be “it depends,” but it definitely starts to represent what we want to see from the velocity graph. A positive trend, generally within 10–20% of initial commitment, with the variability calming down over time.
Free GSheet Template you can try out yourself!
Final Notes
All of these numbers are easy to find in Jira. You could automate everything through some fancy Google Sheet scripting and a connection to Jira Cloud for Sheets Add-On, but it took about 15 minutes every two weeks, so I never got around to it.
If you are unable to find these numbers, comment below and I’ll help you out. Most can be found in the Burndown chart and Sprint Report within Jira.
Hopefully, the above metrics will help shed a bit more light on the volatility of a sprint that pure velocity absolutely cannot measure. Amanda Quint wrote another great post called “3 Metrics for Engineering Team Success Other Than Velocity” which gives some other ideas as well.
In a vacuum you can make up any story you want, so look at the story told by all of your metrics before making process changes.
Above all else, think about whether the outcomes are captured in the numbers. If not, then figure out how else to capture the outcomes you’re looking for.


