Growth Is Not Linear
So why do we convince ourselves otherwise?
So why do we convince ourselves otherwise?

We’ve all experienced that moment. “I’m not good enough.” “I’m never going to understand this.” “Why won’t this work.”
As a manager, it’s my responsibility to ensure folks have the right tools and opportunities to grow their skills. This involves coaching, encouraging, and sometimes coaxing folks to realize that roadblocks and struggles are not necessarily a sign of weakness, but a part of the learning process.
The Dunning-Kruger Effect
Intended to showcase the curve of ignorance, wisdom, and confidence on a particular subject, I used this to highlight the struggles someone may experience when onboarding or learning a new subject.
As I discussed this with individuals, it helped them feel better about that initial peak and decline (lovingly referred to as “Mount Stupid”) where you know enough to know that you know nothing. It’s a crushing realization and confidence dips quite a bit, but that slow growth curve on the right gives you something to look forward to.
While it was a helpful model to point to, that slow incline on the right is still fairly daunting. I continued to search for other representations of the learning journey until I landed on the following.
Weinberg’s Black Knight Model
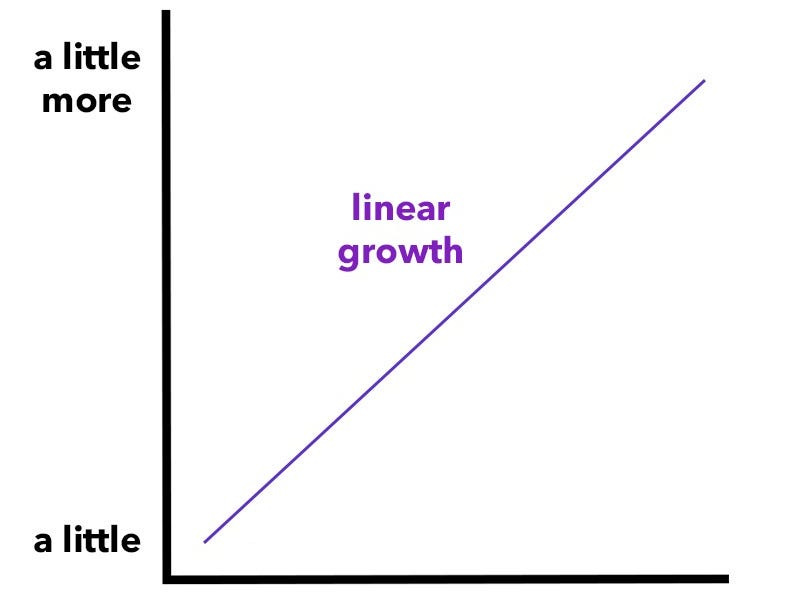
Gerald M. Weinberg outlines in “Becoming a Technical Leader” his journey of learning through the lens of his time with the “Black Knight” pinball game. Tracking his scores over time, he noticed that his growth was linear. But of course! I play the game more, I do better over time because I am a learning system.
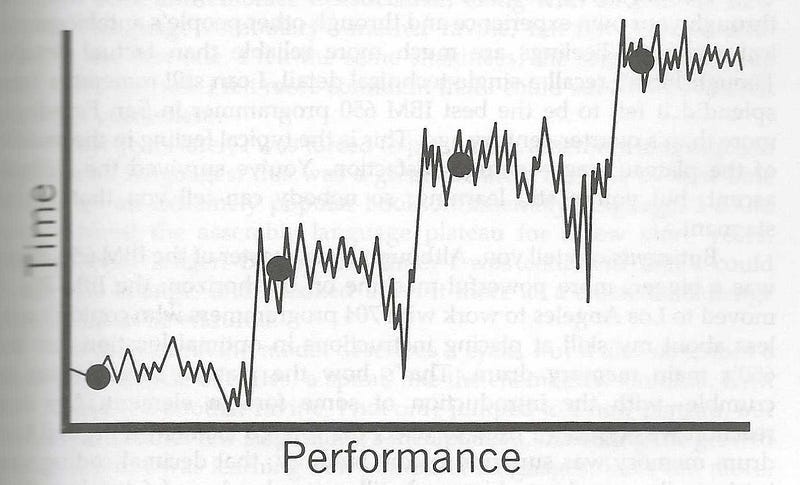
He then zoomed in on the data, looking at a higher saturation of points. Oh, now we see some similarities to Dunning-Kruger. Spike, plateau, dip, repeat. Weinberg explained these as learning zones, where he would find something new out about the game, would lean hard into those (doing somewhat worse), then jump in points in the next few tries.
It’s easy to say “Look for a better strategy,” but it’s not so easy to do.

In this way, he shows that learning something new, and growth in general, is a series of what Dunning-Kruger represents. You don’t hit Mount Stupid, have a decline, then grow from there. Instead, you hit Mount Stupid, struggle, start to get it, surpass your previous knowledge and hit another peak. The first time I saw this I was pleased, but it gets even better.
The Darkest Knight Model
Enhancing the data even further, Weinberg came across another discovery. That final dip is massive. In trying to solve new problems, the plateau breaks up with its own peaks and valleys, followed by one MASSIVE dip. Just before it clicks, the struggle is real.

I’ve since used this model to showcase that our struggles are not futile. When we are struggling the most (or feel like we’re about to give up) we may be on the edge of another breakthrough. Instead of giving up, it’s important to push through, connect the dots one more time, and see if we get to the desired result. You may have heard this referred to as “the light bulb moment,” when everything clicks and you reach a moment of enlightenment.
My corny connection is to the cliche “the night is always darkest before the dawn,” thus the punny “Darkest Knight,” get it? Hilarious right? Before our periods of enlightenment may lie our biggest struggles, so don’t be discouraged. From Weinberg:
No matter how high and mighty you get, you never forget the very real pain of those ravines. Without the hope of something better, however, the pain would turn you back before you got started.
Final Thoughts
There are many models out there to represent the struggles of learning, but Weinberg’s gives me the most hope overall. While his collection of data revolves around pinball, it’s something we can apply to our day-to-day whether that be programming, learning calculus, or even learning a foreign language.
You will face dips, but you will also experience spikes. Celebrate those spikes!
What other models have you seen be helpful in remembering that growth is a marathon and not a sprint? Where have you seen your peaks and valleys?


